Improving Time Tracking Visibility in Jira with Scripting and Google Sheets
Written by
Ben Carle
Last updated on:
October 1, 2025
Written by
Last updated on:
October 1, 2025
Jira work logs provide a straightforward approach for a team to log time against the stories and subtasks in a sprint. At the team level they provide a scrum master with current status on each issue in progress. If used properly they can even provide an accurate burndown that can help determine the likelihood of hitting sprint commitments and can be used to trigger intervention if the sprint goal is in trouble.
At the individual level however, Jira does not provide much visibility into the work logs recorded on a particular issue or across an entire sprint. This can make it difficult for a developer to verify that they have logged work properly or for a manager to review the team’s engagement and efficiency in a sprint.
Time tracking is an essential tool in consulting engineering, and is a key part of our playbook here at FulLStack Labs. In this article we will examine how to improve visibility into individual time tracking without the use of paid integrations. Through scripting against the Jira API and charting in Google Sheets we can provide an additional window into Jira work logs.
Jira Work Log Primer
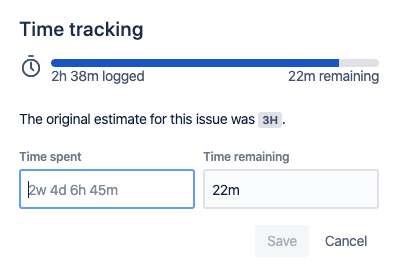
Work logs in Jira can be added through the time tracking section of the Jira issue screen.
This provides the ability to enter an amount of time spent for the work log. The time remaining will be automatically recalculated based on the new time spent, but the user can also override the time spent to enter a custom value. (more on this later)
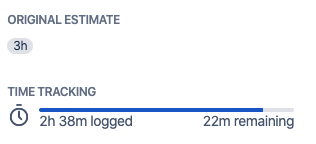
Once time is entered, the total logged time can be viewed in the issue screen, along with the original estimate and time remaining.
The list of worklogs can also be viewed from the issue screen by selecting work logs below the issue description area.
This provides a clear view into the aggregate time and progress on an issue and the granular log of the time entered. However, it is difficult to understand the time spent by each team member, since multiple team members can log time on the same issue. (see above)
Understanding a specific team member’s time across multiple issues, such as at the sprint level, is even more difficult. Jira offers a few reports related to work logs and time tracking, but nothing that tracks a single user across multiple issues.
Jira API
Jira may not offer built-in reporting for aggregate user time logs, but the Jira REST API contains all the information we need to construct those data. The Jira REST API will provide us with issue and work log data in JSON format. Let’s lay out our plan:
Fetch Jira issues (with work logs) for a specific sprint through the REST API.
Parse the JSON response to CSV and copy to the clipboard.
Paste the CSV data into a spreadsheet.
Analyze the data with formulas and charts.
Technology
To access the REST API we will use a JavaScript application built with a Node runtime. Additionally we will use the following npm packages to help simplify the process
Before you can interact with the Jira REST API, you need to create an API token for your user. See the Jira documentation to learn more about creating an API token or get started and create one.
Configuration
We will configure our script with a `.env` file. You will need to set the following values:
To retrieve issues with worklogs we will use the search function. We will pass a JQL query to describe the issues we want, as well as an array of fields we would like to receive for those issues:
The Jira REST API will limit the number of results it will give us through the search function, so to be safe we need to paginate our search into multiple requests. Here is the full code with the search function wrapped in a for loop:
const project = process.env.PROJECT_KEY;
const sprint = process.env.SPRINT_ID;
const maxResults = 50;
let startAt = 0;
let total = 1;
let issues = [];

for (let response; startAt < total; startAt += maxResults) {
  response = await jira.search.search({
    jql: `project = ${project} AND Sprint = ${sprint}`,
    fields: ['id', 'key', 'issuetype', 'parent', 'worklog'],
    maxResults,
    startAt,
  });

  total = response.total;
  issues = [...issues, ...response.issues];
}
Process
Worklogs contain a lot of data. Here is an example:
{
"self": "http://www.example.com/jira/rest/api/2/issue/10010/worklog/10000",
"author": {
"self": "http://www.example.com/jira/rest/api/2/user?username=fred",
"name": "fred",
"displayName": "Fred F. User",
"active": false },
"updateAuthor": {
"self": "http://www.example.com/jira/rest/api/2/user?username=fred",
"name": "fred",
"displayName": "Fred F. User",
"active": false },
"comment": "I did some work here.",
"updated": "2016-03-16T04:22:37.471+0000",
"visibility": {
"type": "group",
"value": "jira-developers" },
"started": "2016-03-16T04:22:37.471+0000",
"timeSpent": "3h 20m",
"timeSpentSeconds": 12000,
"id": "100028",
"issueId": "10002"}
This is a good time to do some prep on our data before copying it into the spreadsheet. The following block will map the work logs into a flat array with issue-level data merged into the work log data:
Then we can execute the parser to parse the JSON into CSV data:
const csv = parser.parse(worklogs);
Finally we are ready to copy our CSV data to our clipboard. The following function and statement will accomplish this task. Note, this may not work on all systems. This has been tested on MacOS.
You can now paste your clipboard to a spreadsheet, such as Google Sheets. You will see data of the following format:
Generating the Spreadsheet
Now let’s examine how the raw work log data from Jira can be processed in a spreadsheet to create visibility through tables and charts. Our aim is to accomplish the following goals:
Visualize the number of hours logged by each developer on each day of a sprint.
Visualize the deviation in hours logged from a target amount, for each day of a sprint.
For the examples in this article we will use Google Sheets as our spreadsheet tool. Most of the examples in this article can be recreated in other popular tools as well.
This part of the article will be organized into sections based on the tabs we will create in the Google Sheet. Each section will be a tab. We will have three sections (tabs) as follows:
Data
Hours
Deviation
Data
To begin, paste the contents of the clipboard into a clean tab to create a raw Data tab. You can apply an alternating color theme (Format > Alternating colors) to make the data more readable. Your data will look something like this:
You should not make any other changes to the data tab. Over time you will want to update this model by pasting in new data from the script. Any edits you make to this tab would have to be reproduced again each time, so keep this as simple as possible. We will add formulas in the other tabs.
Hours
The Hours tab will accomplish our first goal of providing visibility into the number of hours logged by each developer on each day of a sprint. Our example sprint will range over one week, from Monday to Friday. We will show the developer and the number of hours for each week.
Developers
The developer names are already present in the data, but we need the unique set of names, and we prefer if they are sorted. We need the following components:
Names: Data!A2:A
Unique: UNIQUE()
Sorted: SORT()
All together our formula for A2 is =SORT(UNIQUE(Data!A2:A),1,TRUE)
The second column (B) will be used to track the target number of hours for each developer. We will set our targets to 6 hours for most developers and 4 hours for a few developers who may have other responsibilities.
Hours by Day
To collect the hours for each developer by each day, we need to sum over the data based on two conditions:
The day matches the date for the column (e.g B1, C1, etc.)
The developer matches the name for the row (e.g A2, A3, etc.)
The SUMIFS function solves this problem with the following signature:
Let’s examine the calculation for Monday (column C) for Amarah Luna (row 2). Criterion 1 will check the date and criterion 2 will check the developer name. We need the following arguments to SUMIFS:
sum_range: Data!$I$2:$I
criteria_range1: Data!$F$2:$F
criterion1: C$1
criteria_range2: Data!$A$2:$A
criterion2: $A2
Because of the column and row anchors in our formula we can now copy and paste this formula to all developers for all days, producing the desired table:
Deviation
The Deviation tab will track a target number of hours for each developer for each day and visualize the amount by which each person logs above or below that number each day.
The first two columns (A & B) will list the developers and targets and will be defined in the same way as in the Hours tab.
Columns C through G will represent the days of the sprint. (Monday through Friday in our example) The value in each cell in those columns will be defined as the difference between the hours logged, which comes from the same cell in the Hours tab, and the target.
For example, on Monday Amarah Luna logged 6 hours and had a target of 4, so her deviation is 2. On the same day Amina Matts logged 3 hours with a target of 4, so her deviation is -1.
The formula for cell C2 is =Hours!C2-$B2
Finally, in the last column (H) we will track the running balance over the sprint. This is useful because it shows the total deviation from target hours in the sprint. This is simply calculated as the sum of cells C through G in the row. E.g. for H2 we define =SUM($C2:$G2). We now have the following:
Highlighting
These data are useful, but it can be difficult to identify problem areas quickly. Especially if there are lots of team members or days in a sprint. To help with this we can add some conditional formatting rules to emphasize gross deviations.
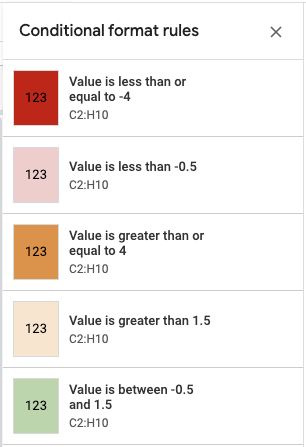
To apply conditional formatting, select the range including all daily deviations and the balance, or {C2:H9} in our example. Click on the menu for Format > Conditional formatting. We will use five bands, defined as five conditional format rules. Add your extreme examples first (min, max) then add inner bands, as order of precedence will be important when the rules are evaluated.
For a min rule we specify to format cells if Less than or equal to with a value of -4. Set the formatting style to add a red background. Click on + Add another rule to repeatedly add the rest of the five rules. When complete, our rules look like the following:
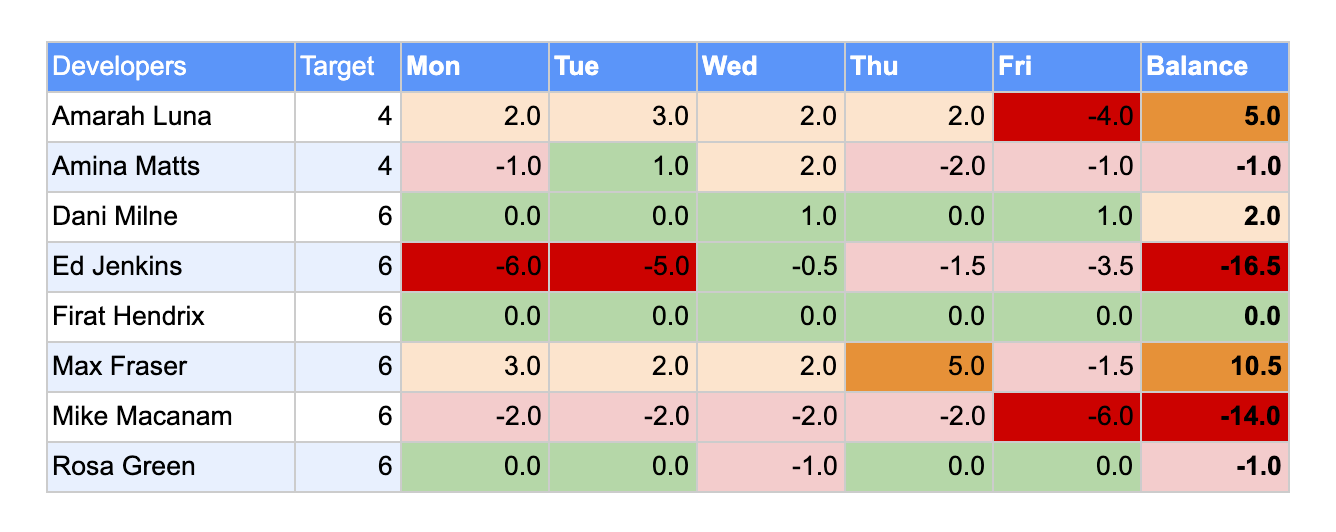
Now our table of deviations looks as follows, and our attention is quickly drawn to areas of concern.
Charting
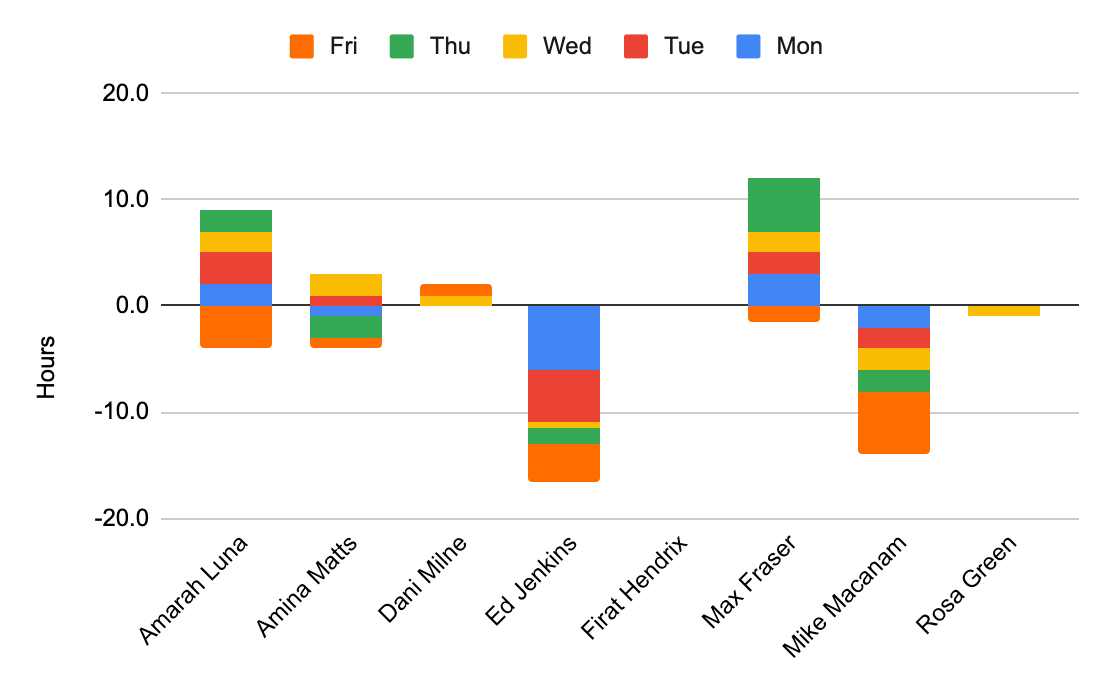
In addition to emphasis via conditional formatting, charts can provide visibility into troublesome patterns in large datasets. Let’s add a chart to our Deviation tab to help in identifying developers who trend in one direction (high or low) throughout a sprint.
Select a range covering the entire table, excluding balance. ({A1:G9}) Click on the menu Insert > Chart. Change the Chart type from Line chart to Stacked column chart. We want to use the developer names, but ignore the targets and balances here, so we want a range that omits columns B and H. Set the Data range to A1:A9,C1:G9.
We want to stack across days for a given developer, so change the Combine ranges setting to Horizontally. Uncheck the option for Switch rows / columns so the developer names are assigned to each stack. You may need to uncheck and re-check the option for Use row 1 as headers as there seems to be a bug with the initial display.
Your chart will come with some default header and footer labels that can be removed, as they are not required. Finally, you should have something like the following:
We can now quickly identify the developers who are consistently trending above or below the target number of hours for each day.
Conclusion
This article shows only a few examples of how a powerful spreadsheet tool can provide visibility into Jira work logs. There is some cost to this approach in terms of setup time, but there is also a benefit of the ability to tailor the data and display to the unique needs of your team.
Find the full source code for this article in the GitHub repository.
Thanks to Adam Burdette for contributing to this script by sharing his work with jira-connector.
What is the problem with Jira's built-in time tracking?
While Jira work logs are useful for tracking overall progress on a sprint, they provide limited visibility into the work logs of individual team members. This makes it difficult for a developer or manager to track a specific person's time across multiple issues.
What is the Jira REST API used for in this process?
The Jira REST API is used to fetch issue and work log data from Jira in a JSON format. This data is then used to create custom reports in a spreadsheet, providing visibility that is not available through Jira’s built-in reporting.
What technologies are needed to build the script?
To build the script, you need a JavaScript application with a Node runtime. The process also uses the jira-connector npm package to simplify REST calls, json2csv to parse JSON to CSV, and dotenv to load environment variables.
How is the raw work log data processed for analysis?
After the raw work log data is fetched from the Jira API, it is parsed from JSON into CSV format. The data is then pasted into a spreadsheet like Google Sheets where it can be analyzed using formulas and charts.
How do you create charts to visualize the time data?
To visualize the data, you can create a stacked column chart in Google Sheets. This chart can show the number of hours logged by each developer and can quickly identify who is consistently above or below their target number of hours.
AI is changing software development.
The Engineer's AI-Enabled Development Handbook is your guide to incorporating AI into development processes for smoother, faster, and smarter development.
Enjoyed the article? Get new content delivered to your inbox.
Subscribe below and stay updated with the latest developer guides and industry insights.
Thank you! Your submission has been received!
Oops! Something went wrong while submitting the form.
We use cookies to provide our services, to allow us to better understand our audience, and to provide and serve personalized ads or content. By using our website, you consent to the terms of our Privacy Policy and our Cookie Policy, and the use of cookies, pixels, and other technology as described more fully therein
The GPC signal has been honored.
Thank you! Your submission has been received!
Oops! Something went wrong while submitting the form.
.svg)